The 12th graders and I started a new unit/project/problem/whatever last week. It started with this image:
What is this?
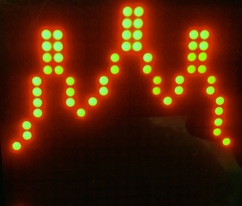
We took some guesses before someone correctly identified the image as the readout from a stationary bike machine. If this was the readout, I nudged, then:
What did the course look like?
I let them play with it for a while. They identified some important questions they had and information they wanted:
So, the next day they came back and and I had them map the course for these two:
- What do the dots represent?
- How can we quantify this?
- Does speed matter?
- Did the bike have gears?
- What do we mean when we say, "what does the course look like?
So, the next day they came back and and I had them map the course for these two:
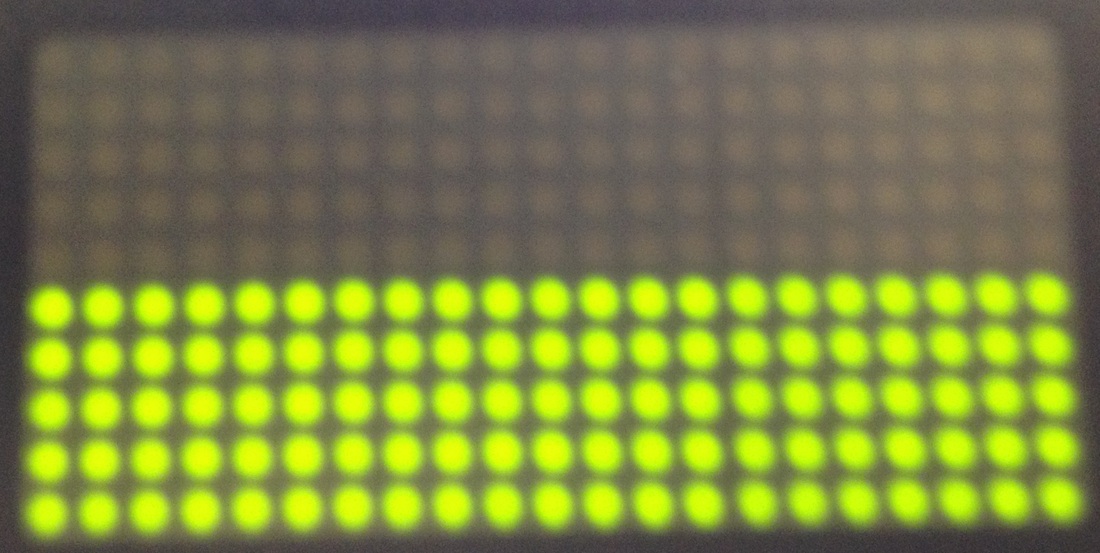 | 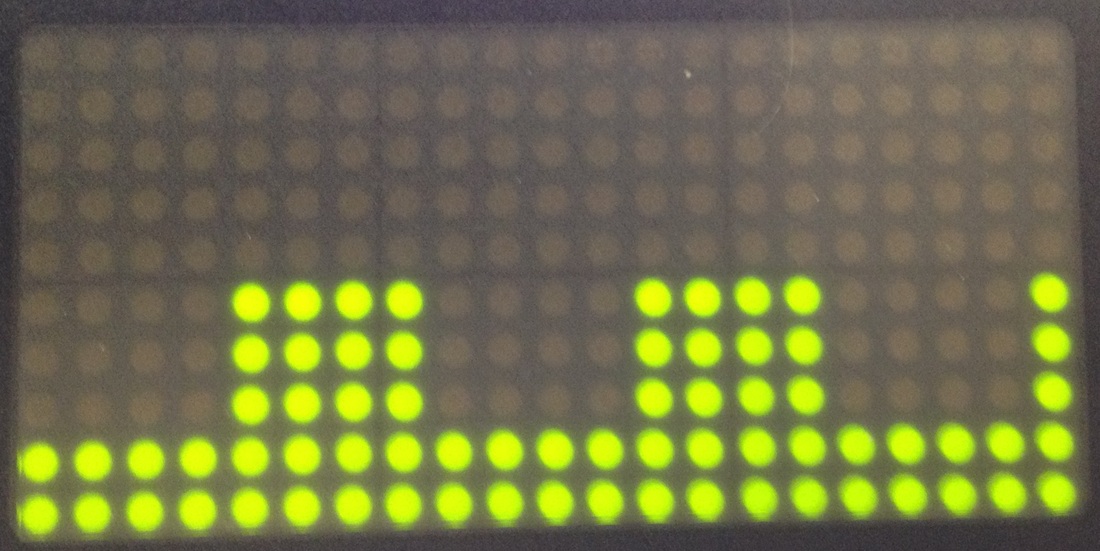 |
This took another class period for them to sort out. By the end, though, they started to feel pretty good about the fact that the dots were a measure of resistance which they connected to the slope of the course at that point. Towards the end of class, someone asked, "What would it look like if you were going downhill?' They talked for a bit and devised a system to handle that, so the next day I gave them this:
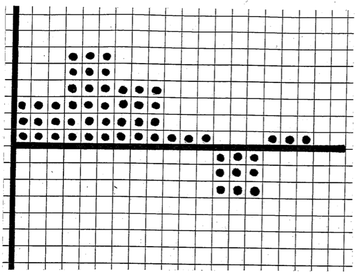
This allowed them to have conversations about what it meant when the resistance was positive, what it means when resistance is zero, and what it means when resistance is negative.
It's fun to watch the students construct an understanding of antiderivatives. The three-day span reminded me of a few things:
I feel like there are a couple ways to go with this trajectory next:
I'm leaning towards #1. What do you think would be best for the students?
It's fun to watch the students construct an understanding of antiderivatives. The three-day span reminded me of a few things:
- the importance of listening to how students are thinking about and making sense of problems
- our role as teachers in responding to that way of knowing by bringing what might be the "next good problem" for them
- allowing them the time to sort things out together
I feel like there are a couple ways to go with this trajectory next:
- Stay with resistance, but use a continuous curve
- Stay with this discrete model, but switch contexts (maybe speed or rate of growth)
- Stay with discrete and resistance, but use a more complicated readout
I'm leaning towards #1. What do you think would be best for the students?

 RSS Feed
